
How We Look at Data
What You Measure Matters
The cattle industry collects and discusses a great deal of data. Much of what is commonly measured and taught, however, has little connection to fertility, longevity, or profitability. It presents well in a sale catalog and fits neatly into a spreadsheet, but it does not always hold up under real grazing conditions.
At the same time, average fertility is declining, calf crops are shrinking, and input costs continue to rise. Producers are frequently told that management is the cause.
The evidence points to genetics as a factor that deserves closer examination.
What the Data Shows
U.S. cattle numbers are at their lowest level in more than 50 years. The decline reflects a structural mismatch between common selection priorities and the realities of production, rather than a lack of effort by producers.
A 90% calf crop is widely regarded as the break-even point for a cow-calf operation. Many international systems fall well short of it. When a herd consistently averages below that mark, genetics — not management alone — may be the limiting factor.
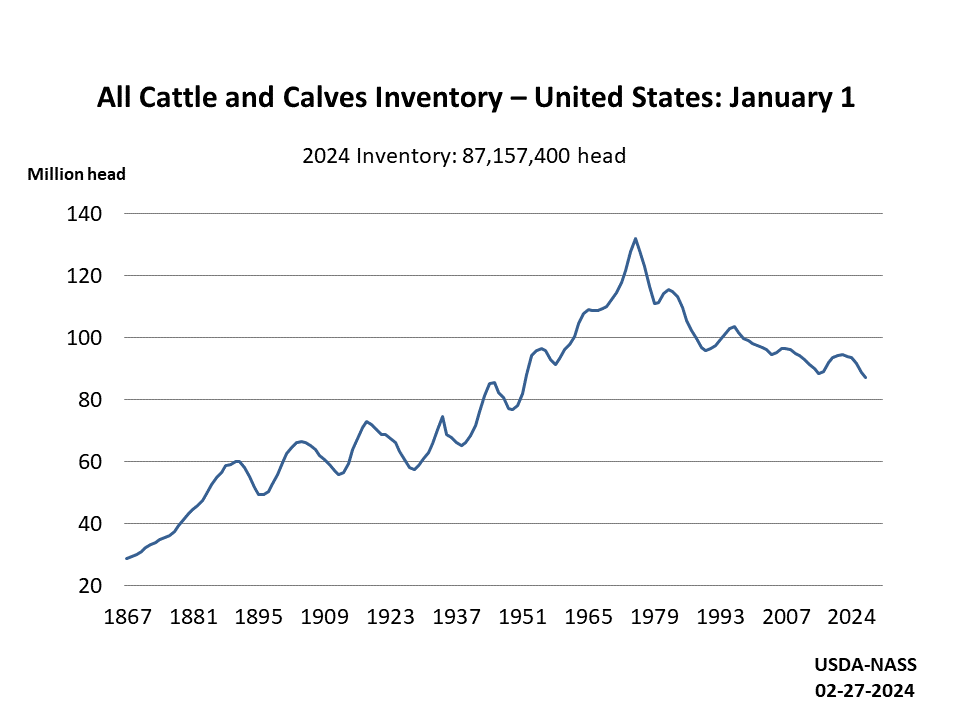
U.S. cattle and calf inventory, showing a multi-decade decline to the lowest levels in over 50 years.
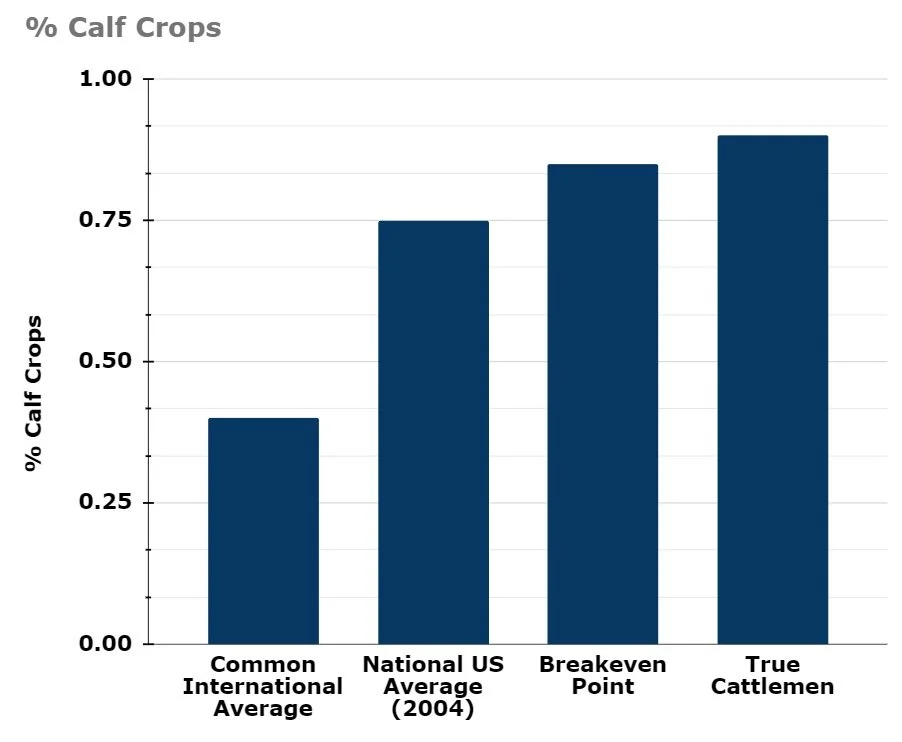
Average calf crop percentages by region, measured against the 90% break-even benchmark.
Fertility Is Highly Heritable
Fertility is often described as a lowly heritable trait. The more accurate explanation is that most systems do not measure the indicators that capture it.
A 2021 Australian study found that direct fertility traits such as age at puberty (AGECL) and postpartum anestrus interval (PPAI) have heritabilities of 56% and 42%, respectively — both highly heritable, and both rarely recorded.
Read supporting studies
Profit Per Acre > Profit Per Head
Rancher A
Rancher B
Producers are paid for the pounds of beef they ship and the number of acres required to produce them, not for individual potential. Rancher B's calves weigh more per head, but Rancher A carries more cows per acre and weans more total pounds. That is the difference between selecting for individual performance and selecting for system-wide efficiency.
The relevant measure is not the size of a single calf, but the total pounds a given area of land can produce.
How EPDs Don't Tell the Whole Story
Animals selected for per-head profit tend to show high growth figures, higher input requirements, and shorter productive lifespans. Animals selected for per-acre profit are typically more moderate, more fertile, and longer-lived.
Many EPD systems also disadvantage balance. A cow that performs consistently across all traits often appears average on paper. Metrics that penalize well-rounded, functional cattle are of limited use for selecting animals that breed back, stay sound, and remain productive over time.
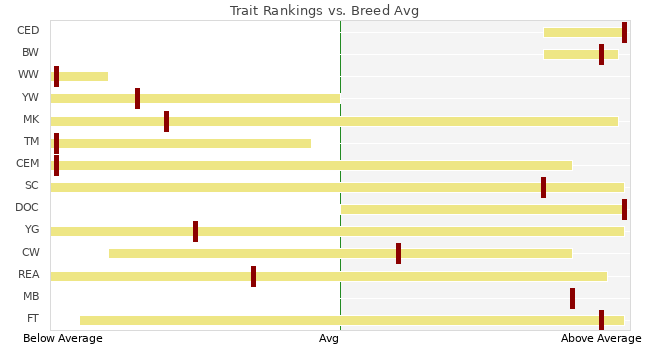
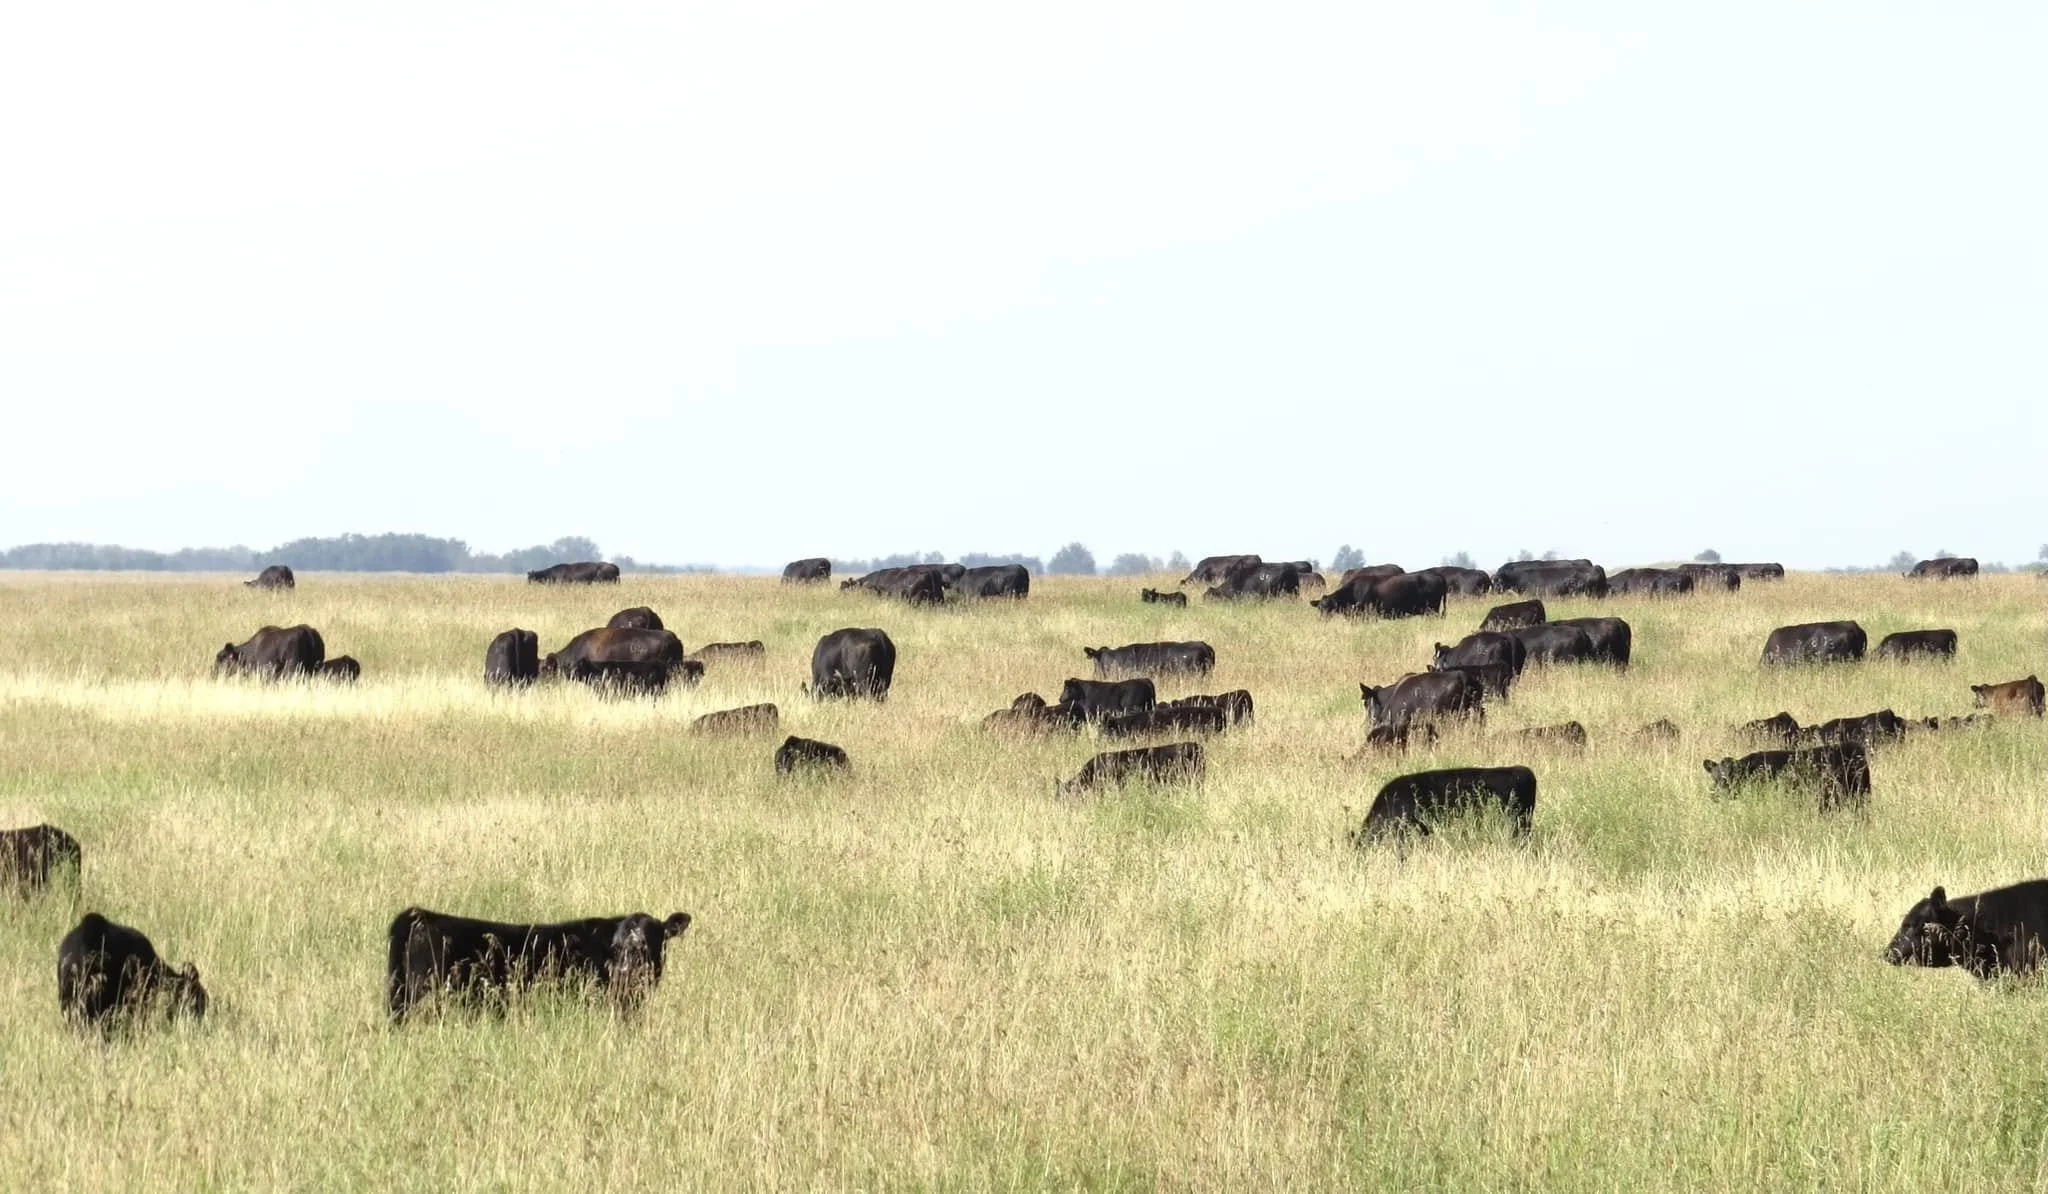
Per-acre bred animal (Bull A)
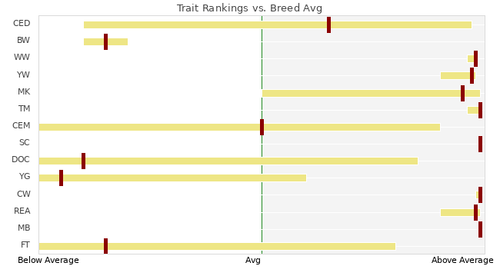
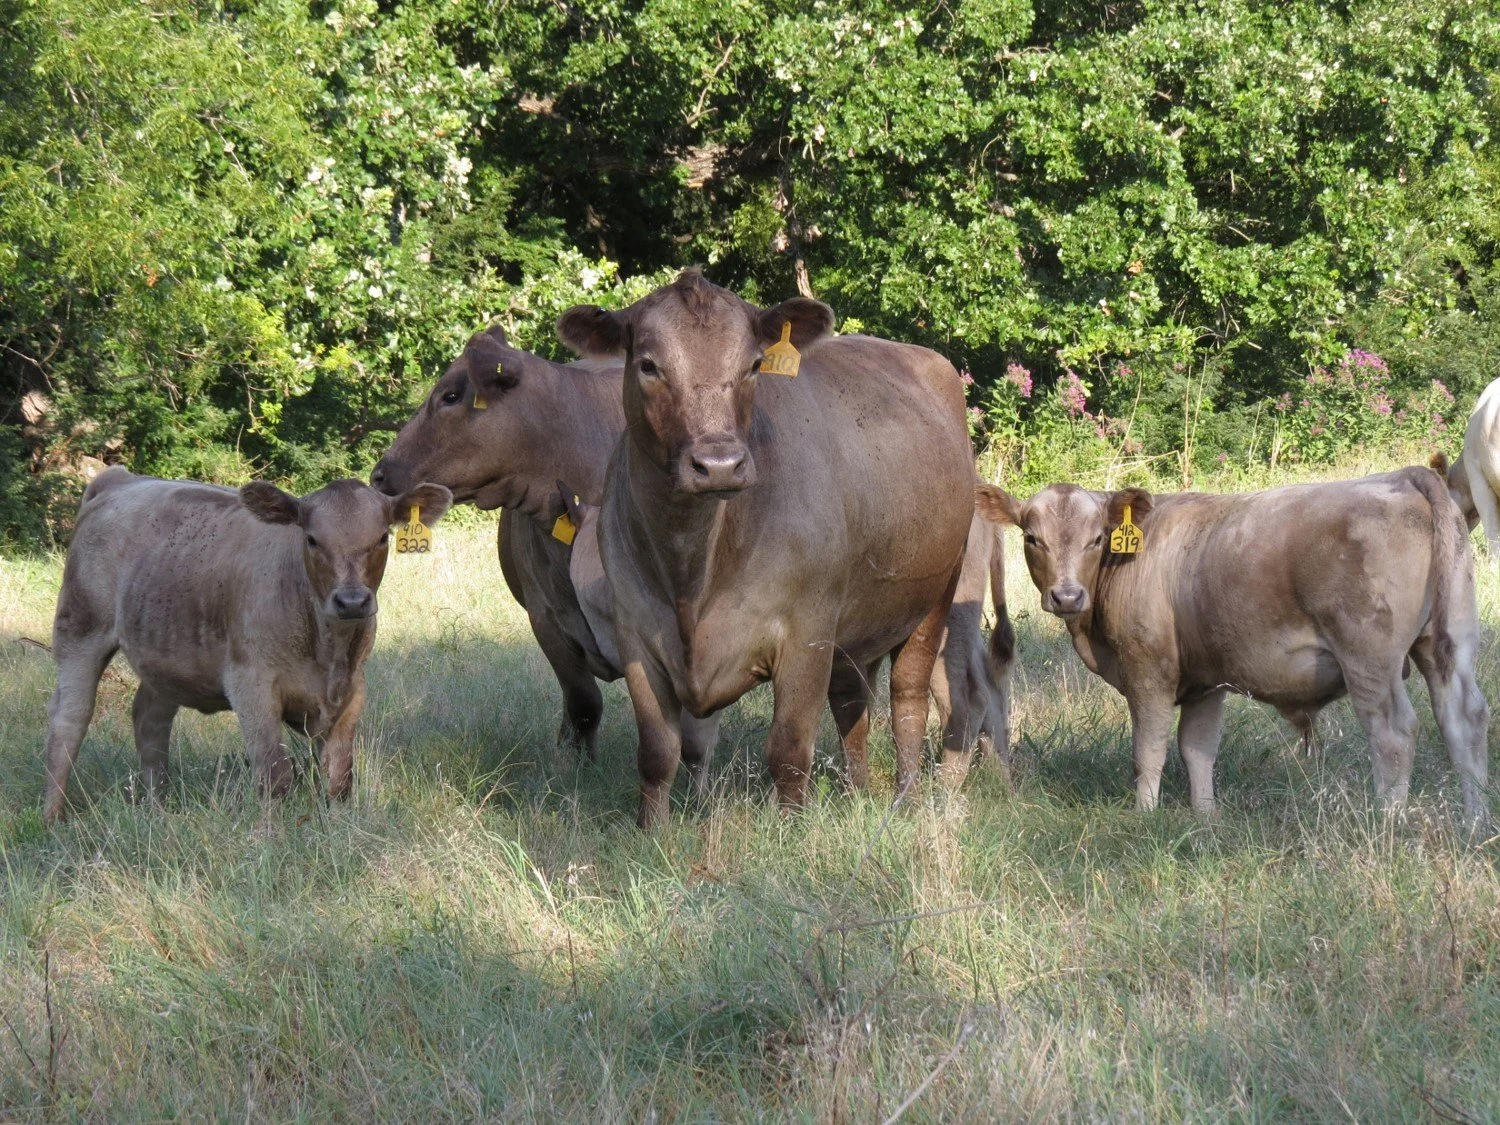
Per-head bred animal (Bull B)
Environment-Specific Selection
Two bulls bred for different environments should not be expected to perform identically. A bull developed for a grass-based, low-input system will not perform like one bred for high feed inputs and rapid gain. Genetics should be matched to the environment rather than the environment to the genetics.
An animal that excels on grass may look unremarkable in a feedlot, and an animal that thrives in a feedlot may struggle on grass. Performance is specific to the system in which an animal is raised, so comparisons made across different systems can be misleading.
Low-input cattle tend to stay in the herd longer because they breed back consistently under the conditions they were selected for. Longevity and regular re-breeding contribute more to lifetime productivity than peak individual output in any single year.
Biological differences between the sexes also matter. A bull and his full sister carry the same genetics, yet under the same conditions a bull will typically show higher intramuscular fat (IMF) than his sister. Selection decisions need to account for these inherent differences rather than treating the animals as directly comparable.
The Bos Sires Standard
Bos Sires evaluates genetics against the measures that determine long-term profitability: fertility, adaptability, longevity, and pounds weaned per acre. These traits are recorded and weighted because they reflect how cattle actually perform in production rather than how they appear on paper.
Every animal in the program is assessed against this standard, so that the genetics offered are selected for the conditions in which they are expected to perform.
Profitable cattle genetics: compare margin, not just weight
Profitable genetics are genetics that contribute to a margin in your own operation. A heavier calf does not automatically generate more profit if producing it requires substantially more feed, labor, veterinary care or replacement females. Neither a sire price nor a pedigree alone predicts the financial result.
Build a partial budget before changing sires: estimate added revenue and costs saved, then subtract added costs and revenue forgone. Include semen or bull purchase, breeding costs, calving assistance, winter feed and the time until offspring can be sold. Test the calculation against lower sale prices and higher feed costs rather than relying on one optimistic forecast.
Compare pregnancy rate, calves weaned per female exposed, cow longevity and saleable weight with the costs of achieving them. Ask which figures are measured, which are estimates and whether comparison groups had similar management. Retain the records needed to revisit the purchase decision; no breed or individual bull can guarantee a profit.
Iowa State University Extension: partial budgetingThis background evidence does not certify any Bos Sires animal.
Review sire options Discuss an operation with a breeder Understand our standards